Recruitment automation delivers measurable outcomes by saving time, reducing costs, and improving hiring efficiency. Calculating its ROI involves comparing the financial benefits – like reduced recruiter hours, faster time-to-fill, and lower agency fees – against total costs, including software, setup, and training. Here’s how you can measure it:
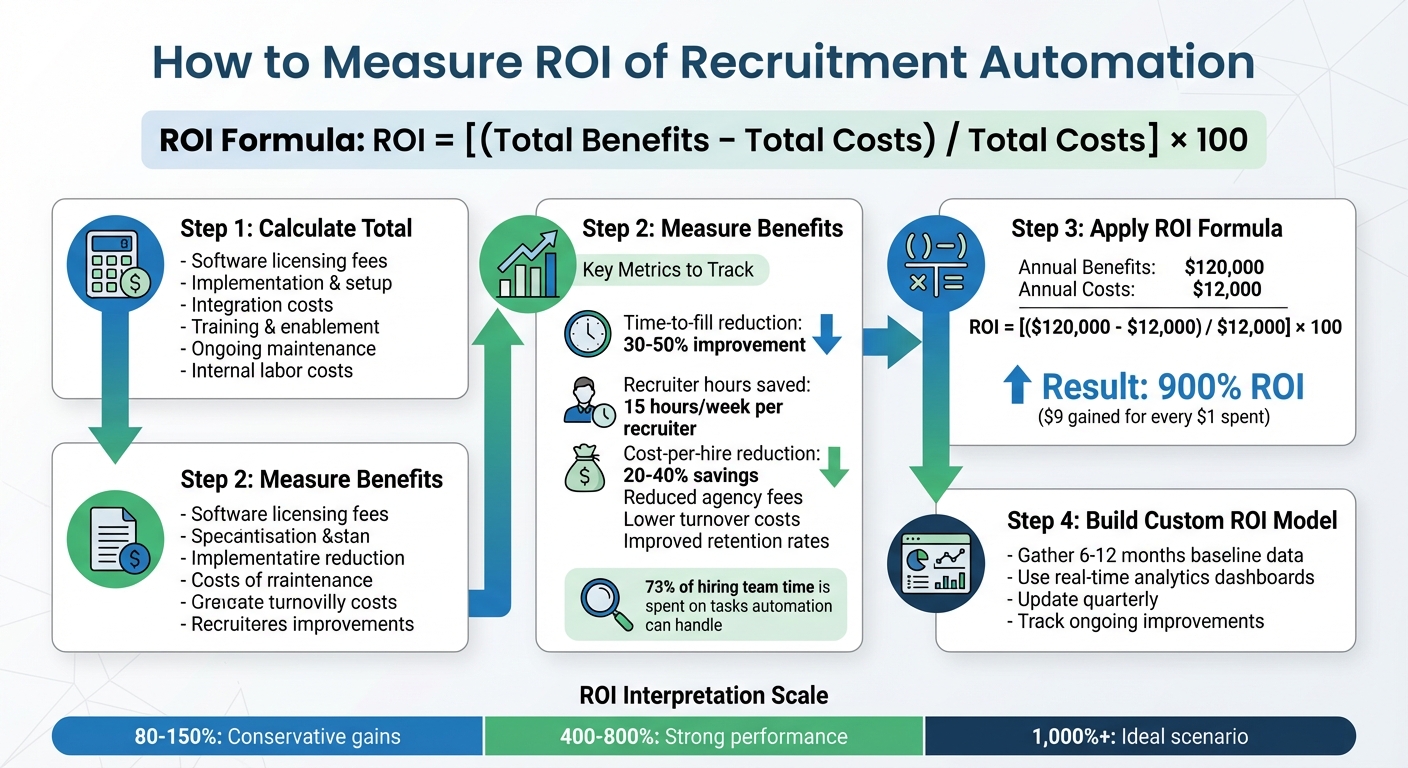
- Formula: ROI = [(Total Benefits – Total Costs) / Total Costs] × 100
- Key Metrics:
- Time saved by recruiters (e.g., 15 hours/week per recruiter)
- Reduction in cost-per-hire (20%-40% savings with automation)
- Faster time-to-fill (30%-50% improvement)
- Improved retention rates and reduced turnover costs
- Example: If automation saves $120,000 annually and costs $12,000, the ROI is 900% – $9 gained for every $1 spent.
Tracking these metrics over time ensures accurate ROI insights while tools like Skillfuel simplify the process with real-time analytics. Recruitment automation is no longer optional – it’s a measurable investment driving hiring success.
4-Step Process to Calculate Recruitment Automation ROI
Step 1: Calculate Total Costs of Recruitment Automation
Identify Key Cost Components
When breaking down the costs of recruitment automation, it’s important to look beyond just the subscription fee.
Start with software licensing – this is your core expense. For instance, Skillfuel provides Free, Premium, and Enterprise plans tailored to teams of various sizes and needs.
Next, don’t forget implementation, setup, and integration costs. These include configuring the system, aligning it with existing workflows, connecting it to tools like ATS, CRM, or HRIS, and migrating data from older systems. Also, account for internal labor costs by calculating the total hourly cost of each team member involved. Recruiterflow highlights this often-overlooked expense:
"Most firms dramatically undercount partner time. If a principal spends 12–20 hours on calibration, outreach, shortlist reviews, and client calls, that’s not ‘free.’"
- Recruiterflow
Factor in training and enablement costs, such as the time your team will need to learn the platform and establish standard operating procedures. Lastly, include ongoing maintenance, which covers technical support, workflow updates, and periodic quality checks.
"The real cost of recruitment automation is not the $5-15K monthly retainer. It is the $30K per week in revenue capacity your team is burning on work that a system should be doing for them."
- Niklas Huetzen, CEO, Automindz
Compare Pre-Automation vs. Post-Automation Costs
Once you’ve detailed all the costs, compare them to the expenses of your manual, pre-automation processes. Track how much time your team spends on each manual task monthly. This will give you a baseline to measure the value automation can deliver.
Here’s a snapshot of how costs typically shift after implementing automation:
| Cost Category | Pre-Automation (Manual) | Post-Automation |
|---|---|---|
| Recruiter Labor | ~30 hours/week on admin tasks | ~15 hours/week freed for strategic work |
| Error Costs | High rework from duplicate applications and manual data entry | Significant reduction with automated validation |
| Agency Fees | Heavy reliance on external agencies to meet hiring volume | Reduced agency spend due to increased internal capacity |
| Time-to-Hire | 41-day average | Potential reduction to 31 days with AI tools |
This comparison creates a clear picture of the efficiency gains and cost reductions automation can bring, setting the foundation for calculating its return on investment.
sbb-itb-e5b9d13
Step 2: Measure the Benefits of Recruitment Automation
Key Metrics to Track
When evaluating recruitment automation, focus on the metrics that reveal its impact. Start with time-to-fill reduction – how many days you shave off from job posting to offer acceptance. Another critical metric is recruiter hours saved, which you can calculate by comparing the time spent on manual tasks versus automated workflows.
Speed is important, but quality of hire is equally crucial. Assess this through retention rates at 90 days or six months, time to productivity, and hiring manager satisfaction scores. Also, measure turnover reduction by tracking the percentage of hires who stay beyond six months. Recent studies show that 73% of a hiring team’s time is spent on tasks that automation could handle, and automating screening alone can save recruiters 8 to 12 hours each week.
Convert Metrics to Dollar Amounts
To truly understand the value of automation, translate these metrics into dollar figures.
For example, calculate recruiter time savings by multiplying the hours saved by the recruiter’s fully-loaded hourly rate. Similarly, estimate vacancy cost savings by dividing a role’s annual value by 260 workdays. If automation saves 10 hours weekly and your recruiter earns $50 per hour, that’s $500 saved each week – or $26,000 annually.
Reducing time-to-fill by 10 days can save between $1,500 and $3,000 per role. To calculate turnover cost reduction, multiply your reduced attrition rate by the average replacement cost, which is typically 20% of an hourly worker’s annual pay. If automation reduces reliance on external agencies, track how many hires shift to internal sourcing and multiply by typical agency fees (15-25% of a first-year salary).
These calculations highlight the financial impact of automation and set the groundwork for understanding how Skillfuel delivers recruitment value.
Skillfuel-Specific Benefits
Skillfuel takes these metrics and turns them into measurable recruitment improvements.
The platform’s automated candidate communication tools, like instant responses and interview reminders, help lower candidate drop-off rates and reduce "ghosting". By simplifying the application process, Skillfuel further minimizes drop-offs.
Its centralized dashboards streamline workflows by eliminating the need to juggle multiple tools. This efficiency boost allows recruiters to handle more open roles. For instance, if a recruiter managed 8 roles before and can now handle 12, that’s a 50% increase in productivity without additional staff. Skillfuel’s real-time dashboards also connect these recruitment gains to reduced turnover and faster employee productivity.
Step 3: Apply the ROI Formula
The ROI Formula
Now that you’ve compared costs and benefits in Steps 1 and 2, it’s time to crunch the numbers. The ROI formula gives you a clear way to measure the financial impact of recruitment automation.
Here’s the formula:
ROI = [(Total Benefits – Total Costs) / Total Costs] × 100.
- Total Benefits: These are the dollar values you calculated in Step 2, based on savings and efficiencies gained.
- Total Costs: This includes expenses like software subscriptions, implementation fees, integration costs, data cleanup, and training.
By subtracting total costs from total benefits, dividing by total costs, and multiplying by 100, you’ll get the ROI percentage.
Let’s see how this works with a real-world example using Skillfuel.
Example ROI Calculation Using Skillfuel
Imagine your company hires 60 people annually and decides to adopt Skillfuel, which costs $12,000 per year (including setup and training).
Here’s how the benefits might add up:
- $54,000 from recruiter time savings (15 hours per week saved at a fully loaded rate of $70/hour).
- $36,000 from reduced agency fees (avoiding 6 agency placements at $6,000 each).
- $18,000 from faster time-to-fill (60 hires × 10 days saved × $30 daily vacancy cost).
- $12,000 from lower turnover costs (thanks to a 5% reduction in first-year attrition).
That brings total benefits to $120,000.
Now, apply the formula:
(($120,000 – $12,000) / $12,000) × 100 = 900% ROI
This means for every dollar spent on Skillfuel, your company gets nine dollars back. With recruitment automation often delivering a 3–10× ROI within the first 90 days and an average ROI of about 340% over 18 months, this 900% ROI highlights the potential of Skillfuel.
Once you’ve run the numbers, the next step is understanding what they mean for your business.
Interpret ROI Results
Here’s how to interpret your ROI:
- 80% to 150%: A conservative range, typically reflecting modest gains in time-to-fill and slight reductions in agency costs.
- 400% to 800%: Indicates strong performance, with noticeable reductions in agency fees and improved recruiter efficiency.
- 1,000%+: Represents an ideal scenario, where agency reliance is drastically lowered, and attrition rates see substantial improvement.
"Time saved only counts when it converts into real outcomes: more reqs closed per recruiter, lower cost-per-hire, reduced agency reliance, fewer interviews to hire, or better first-year retention." – Ameya Deshmukh, Talent Leader
It’s important to remember that ROI isn’t static. For example, if only 60% of your team fully adopts Skillfuel, you’ll only see 60% of the potential savings. Long-term benefits like improved candidate experience, better hiring fit, and stronger employer branding should also be part of your ROI analysis. Plus, AI-driven screening can cut time-to-hire by 35%, while a bad hire can cost up to 30% of an employee’s annual salary.
Step 4: Build Your Custom ROI Model
Gather Baseline Data
To create a reliable foundation for your ROI model, start by collecting 6–12 months of historical data. This timeframe helps smooth out seasonal fluctuations and provides a dependable benchmark for analysis.
Focus on gathering these key metrics:
- Average time-to-hire: The total number of days from job kickoff to offer acceptance.
- Average cost-per-hire: Combine all internal and external hiring costs, then divide by the number of hires.
- Quality-of-hire scores: Measure retention rates or performance ratings at 90 or 180 days.
- Recruiter workload: Track weekly hours spent on manual tasks like screening and sourcing. Be sure to calculate the recruiter’s fully loaded hourly rate.
Another critical metric is the cost of vacancy. To calculate this, divide the annual revenue contribution by the number of workdays to estimate daily lost productivity.
Segment your data by role type (e.g., sales, engineering, administrative) and seniority level. Automation often impacts high-volume or technical roles differently than executive-level searches. For context, SHRM reported that the average cost-per-hire in 2022 was around $4,700, while a poor hiring decision could cost as much as 21% of an employee’s annual salary.
| Metric | What to Include in Your Baseline |
|---|---|
| Average Time-to-Hire | Total days from job kickoff to offer acceptance |
| Average Cost-per-Hire | Internal labor + external spend (e.g., agencies, job boards) divided by the number of hires |
| Quality-of-Hire Score | Retention rates and performance ratings at 90 or 180 days |
| Recruiter Workload | Weekly hours on manual tasks like screening, sourcing, and scheduling |
| Offer Acceptance Rate | Percentage of extended offers that candidates accept |
These metrics serve as the baseline for evaluating recruitment efficiency with Skillfuel’s real-time analytics.
Use Skillfuel Analytics
Once your baseline is set, leverage Skillfuel Analytics to track performance metrics in real time. This tool, available with Premium and Enterprise plans, automates the process by capturing data on task durations, such as screening and scheduling. Instead of relying on manual tracking or estimates, Skillfuel’s real-time dashboards provide precise insights into how your team spends its time.
These dashboards transform ROI tracking into a proactive process. For instance, you can immediately identify trends like rising cost-per-hire, delays in filling roles, or a sourcing channel that’s no longer delivering quality candidates.
Additionally, Skillfuel’s centralized candidate repository and Kanban workflow management highlight which stages of your hiring process consume the most time and resources. By comparing pre-automation benchmarks with current performance, you can pinpoint the specific benefits of automation, independent of external factors like market trends or employer branding improvements.
This ongoing monitoring ensures your ROI model remains relevant and actionable.
Update Your ROI Model Regularly
To keep your ROI model accurate, update it regularly to reflect changes in market conditions and hiring needs. A quarterly review is a good practice for recalculating ROI and tracking new efficiencies as your team grows.
During these updates, focus on the following areas:
- Cost components: Include software subscriptions, IT admin time, and training hours.
- Efficiency metrics: Reassess time-to-hire and recruiter hours per hire.
- Quality indicators: Monitor 90-day and 180-day attrition rates.
- Financial data: Include fully loaded hourly rates and savings from avoided agency fees.
Keep in mind that early attrition is a crucial metric – about 30% of employees leave within their first six months.
"ROI isn’t a static calculation; it’s a signal that helps teams decide where to invest, what to fix, and what to stop doing." – Ayusmita, Recruiterflow
Regular updates not only validate your initial assumptions but also ensure your ROI model reflects actual outcomes rather than overly optimistic projections. While 44% of organizations report faster hiring with AI recruiting software, many still struggle to quantify the exact monetary impact of these improvements.
Recruitment Metrics and ROI | Exclusive Lesson
Conclusion
Tracking recruitment ROI turns hiring into a powerful driver of measurable business outcomes. By applying the four steps shared in this guide, you can move from vague notions of "efficiency" to tangible results like reduced cost-per-hire, shorter time-to-fill, and higher-quality hires.
The numbers speak for themselves. Companies leveraging recruitment automation often achieve 3–10x ROI within just 90 days, and staffing firms using these tools are 2.4 times more likely to see revenue growth. When you account for the time spent on manual tasks like screening resumes, scheduling interviews, and following up with candidates, the potential savings become clear. In fact, 73% of a hiring team’s time is currently consumed by tasks that automation can handle.
Skillfuel’s real-time analytics and centralized dashboards simplify this process by automatically capturing task durations. This eliminates the need for clunky spreadsheets and allows recruiters to focus on high-impact activities like interviewing and closing candidates. By combining Skillfuel’s tools with the steps outlined here, teams can shift from manual tracking to making smarter, data-driven hiring decisions. And remember, measuring ROI isn’t a one-time effort – ongoing analysis ensures that your recruitment strategy continues to evolve and improve over time.
FAQs
What data do I need before implementing recruitment automation to measure ROI?
Before diving into recruitment automation, it’s important to collect baseline data on key metrics such as current costs, time-to-fill, and quality of hire. These benchmarks serve as a reference point to gauge improvements after automation – like reduced costs, quicker hiring processes, and higher-quality candidates. Having a clear picture of your current recruitment expenses and timelines is crucial for accurately calculating ROI. You can use a formula like (benefits – costs) ÷ costs to assess the value automation brings to your hiring process.
How do I estimate the cost of vacancy for my roles?
To figure out the cost of vacancy, you’ll need to account for both direct and indirect expenses. Start by calculating the revenue or productivity lost during the time the role remains unfilled. Then, factor in extra costs like overtime pay, hiring temporary staff, or setbacks caused by project delays. Understanding this financial impact can help guide decisions around recruitment strategies and automation investments.
How often should I recalculate ROI after launching Skillfuel?
Reassessing ROI every 3 to 6 months after launching Skillfuel is a smart move, especially in the first year. This approach helps you keep tabs on performance, fine-tune processes, and showcase results to stakeholders. Regular check-ins also allow you to measure the effects of automation and tweak strategies as necessary.