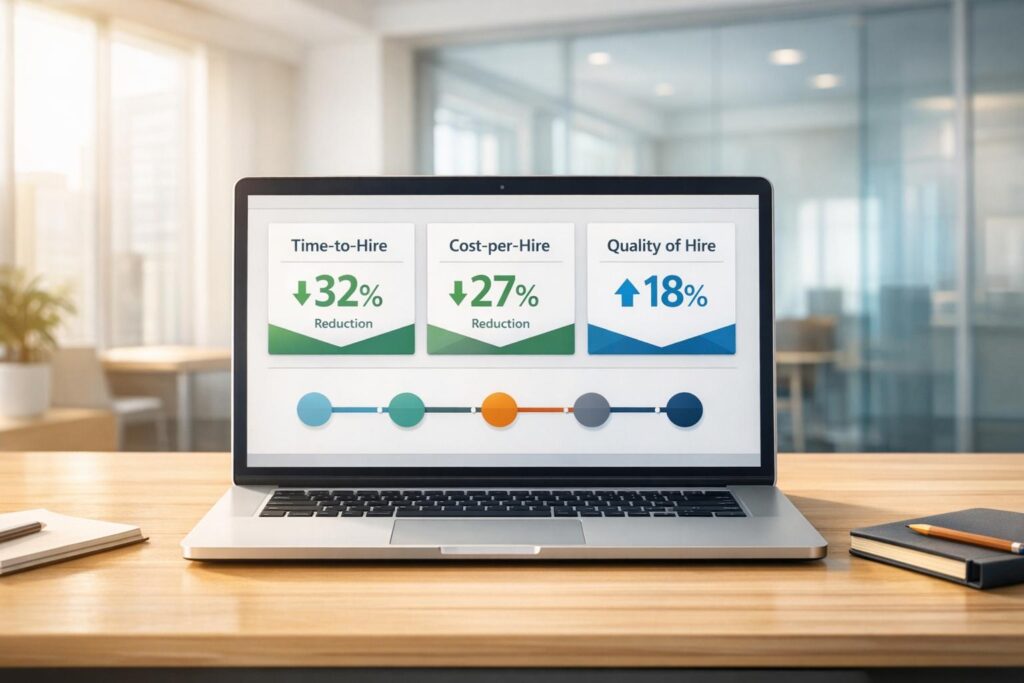
Recruitment dashboards simplify hiring by consolidating key metrics like time-to-hire, cost-per-hire, and candidate progression into visual formats such as charts and graphs. Custom dashboards go beyond templates, letting you tailor data to your hiring goals, whether it’s speeding up hiring, reducing costs, or improving candidate quality. Here’s what you need to know:
- Define Goals: Focus on 3–5 key questions like "Where are candidates dropping off?" or "Which roles need immediate attention?"
- Choose Metrics: Examples include time-to-hire, cost-per-hire, offer acceptance rates, and source effectiveness.
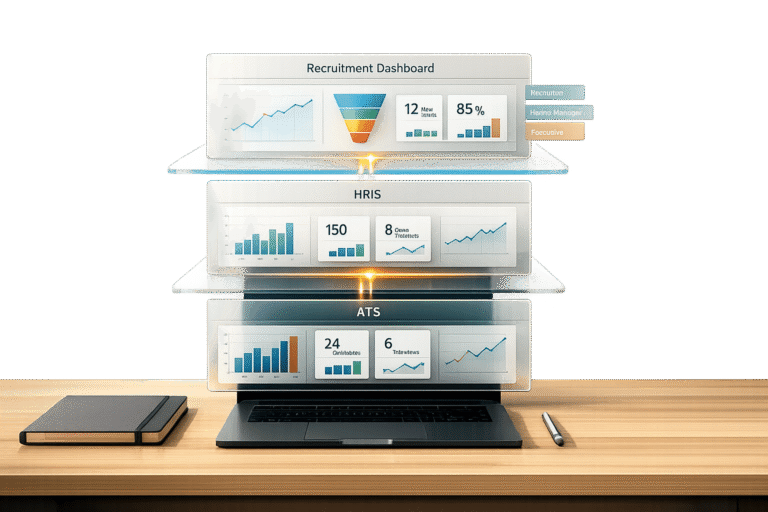
- Connect Data Sources: Pull data from tools like ATS, HRIS, and payroll systems, ensuring clean and consistent records.
- Design Layouts: Use simple visuals (e.g., bar charts, funnel charts) and group metrics logically (e.g., workload, speed, quality).
- Tailor Views: Create role-specific dashboards for recruiters, hiring managers, and executives.
- Use Tools: Platforms like Skillfuel streamline dashboard creation with drag-and-drop features, filters, and automation.
Dashboards save time, highlight inefficiencies, and help teams make informed decisions. Start small, refine over time, and align metrics with your hiring strategy.
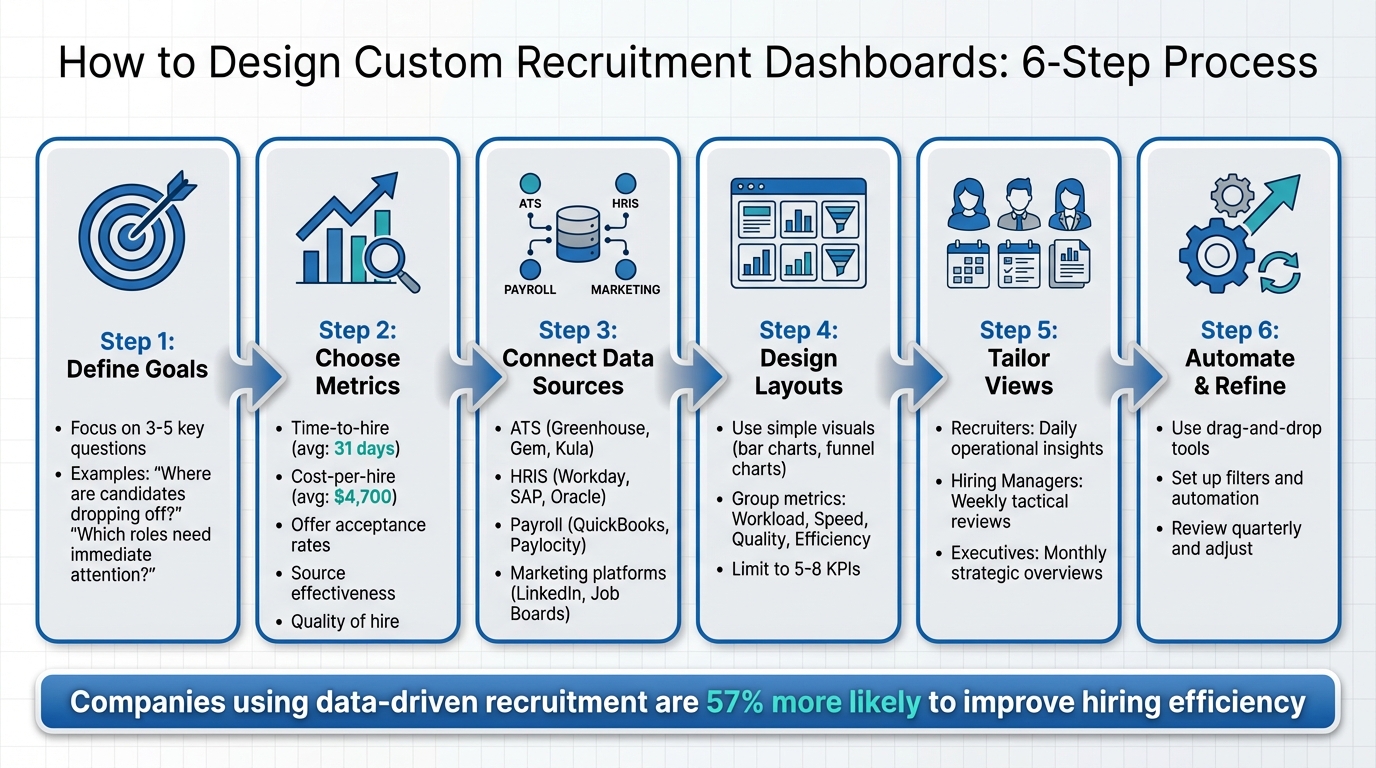
6-Step Process for Designing Custom Recruitment Dashboards
Build a Recruitment Dashboard in Power BI (Step-by-Step Guide)
sbb-itb-e5b9d13
Identifying Your Goals and Metrics
Before diving into dashboard creation, start by asking yourself: What specific challenges need solving? Your dashboard should focus on answering 3–5 key questions that are critical to your hiring process. For instance, you might ask, "Where are we losing candidates?" or "Which roles require immediate attention?" By zeroing in on these questions, you ensure your dashboard stays practical and actionable. This clarity also helps you define recruitment goals that align with your priorities.
Your goals might differ depending on your situation. If you’re in growth mode, speed is essential – track metrics like time-to-hire to fill roles quickly. If cost reduction is your priority, focus on cost-per-hire to identify inefficient channels. And if long-term quality is your aim, monitor metrics like offer acceptance rates and retention. Take Eaton, a global power management company, as an example. They tracked metrics like "time to market", "time to present", "time to offer", and "candidate velocity." This approach led to a 30%–40% improvement in candidate velocity and a fourfold expansion of their talent network.
Setting Your Recruitment Goals
Understanding user needs is key to setting effective recruitment goals. Recruiters need daily insights, such as open roles, application numbers, and deadlines, to manage their pipelines. Executives, on the other hand, benefit from monthly overviews that highlight trends, ROI, and the overall health of recruitment strategies. To meet these needs, design dashboards that provide daily updates for operational tasks, weekly reviews to address bottlenecks, and monthly analyses of costs and hiring quality.
Different recruitment goals often require different types of dashboards. For example:
- Operational dashboards handle time-sensitive tasks like tracking vacancies.
- Analytical dashboards uncover trends, such as which recruitment channels deliver the best candidates.
- Strategic dashboards focus on long-term metrics like quality of hire and retention rates.
Many teams find that combining real-time tracking with trend analysis creates a more complete picture. Once your goals are clear, you can select metrics that directly align with these objectives.
Choosing the Right Metrics
After defining your goals, pick metrics that directly address your key questions. For context, the average cost of hiring a new employee is around $4,700, and the average time-to-hire is 31 days. However, these benchmarks are most useful when tailored to your specific priorities.
- Time-to-hire measures how quickly candidates move through your hiring process.
- Cost-per-hire accounts for both external costs (e.g., job boards, agency fees) and internal expenses (e.g., recruiter salaries, hiring manager time).
- Offer acceptance rate provides insights into your employer brand and whether your compensation packages are competitive.
- Quality of hire evaluates the long-term value of new hires, factoring in performance and retention. This is especially important since replacing an employee can cost up to three times their annual salary.
"Numbers reveal recruitment successes and inefficiencies." – Wellhub Editorial Team
Connecting Your Data Sources
With clear metrics established, the next step is consolidating your data to turn it into actionable insights. Start by identifying where your data lives and extracting it from those systems. For example, your Applicant Tracking System (ATS) often contains key metrics like time-to-hire and candidate progression, while your HRIS captures details about employee lifecycle events such as retention and start dates. Finance tools, like payroll systems (e.g., QuickBooks), can provide cost-per-hire and agency fee data, while platforms like LinkedIn and job boards offer insights into candidate engagement.
A great example of this in action comes from June 2022, when Grafana Labs used Fivetran to pull data from Greenhouse (their ATS) into Google BigQuery. They then transformed this data using dbt and Prefect, which helped them cut their time-to-hire by 25%. Consolidating data like this creates a strong foundation for identifying sources and ensuring data quality.
| Data Source Category | Common Systems | Key Metrics Provided |
|---|---|---|
| Applicant Tracking (ATS) | Greenhouse, Gem, Kula, Recruit CRM | Time-to-fill, candidate progression, source effectiveness |
| HRIS / Employee Data | Workday, SAP, Oracle | Employee lifecycle, retention, post-hire performance |
| Finance / Payroll | Paylocity, QuickBooks | Cost-per-hire, agency fees, advertising spend |
| Marketing / Sourcing | LinkedIn, Job Boards, Career Sites | Candidate engagement, click-through rates, traffic |
When the same data exists in multiple systems – like a "Department" field in both your ATS and HRIS – choose the system with the most detailed and accurate information. If API integration isn’t an option, export the data in standardized formats like CSV or XLSX, which most analytics tools can process.
Finding Your Data Sources
Start by listing all systems that house the metrics you’ve defined. Consult with key stakeholders to identify the most important recruitment questions, such as “Which sources bring in the best candidates?” Then, map those questions to the relevant data sources. Don’t overlook systems that manage workforce performance, candidate feedback, or other recruitment-related processes. Research shows that companies using data-driven recruitment strategies are 57% more likely to improve hiring efficiency.
Before connecting any new data sources, perform a thorough data audit. For instance, review 20–30 recent hires in your ATS to check for issues like missing timestamps, inconsistent tracking of candidate stages, or incomplete records. If recruiters aren’t consistently logging key details like source information, address these process gaps before moving forward.
"Manual efforts will not generate accurate results since the data is scattered… you need dashboards to improve data quality"
Clean data can make a huge difference – organizations using clean data report up to 70% higher revenue compared to those relying on uncleaned data.
Maintaining Data Quality
Once you’ve identified and connected your data sources, keeping your data clean and consistent is critical. Start by removing duplicates and filling in incomplete records. Standardize fields like "location", "department", and "source categories" across all systems to ensure filters and analytics work properly. Also, align definitions across teams to maintain consistency.
Set up automated data feeds to keep your dashboards updated. Use real-time updates for operational tasks or daily refreshes for analytical reviews. If a system doesn’t allow direct integration, you can use a spreadsheet as a workaround – import the data into a "Raw Data" tab and use formulas to pull it into your analytics tool. Finally, implement role-based access controls to protect your data and ensure its integrity. Companies tracking hiring data in real time have been shown to reduce their time-to-hire by as much as 25%.
Designing Your Dashboard Layout
Turning raw numbers into actionable insights starts with a well-thought-out dashboard layout. When your data is clean and organized, the next step is designing a structure that makes those insights easy to find and use. A good dashboard allows users to locate key information in seconds.
Grouping Metrics by Category
To make your dashboard intuitive, organize metrics into sections that align with your hiring goals and how your team operates. A common approach is to divide the data into four main categories: Workload (e.g., open roles, aging requisitions), Speed (bottlenecks, time-in-stage), Quality (offer acceptance rates), and Efficiency (cost-per-hire, ROI).
Start with high-level summaries at the top and drill down into details below. For example, begin with a KPI tile showing the total number of open positions, followed by a table breaking down each role’s current stage and days open. Place your most critical metrics in the top-left corner and along the top row, following the F-shaped scanning pattern that users naturally follow. Keep the dashboard focused with 5–8 KPIs to avoid overwhelming users.
It’s also crucial to document how each metric is calculated. For instance, clarify whether "Time to Hire" begins when a requisition is opened or when the first candidate applies. This transparency ensures everyone interprets the data the same way.
Choosing the Right Visuals
The type of chart you choose can make or break how easily your data is understood. Here are some examples:
- Funnel charts: Ideal for visualizing candidate progression and spotting drop-off points in your pipeline.
- Line charts: Great for tracking trends over time, like hiring velocity or application volume.
- Bar or column charts: Best for comparing categories, such as hires by department or source performance.
- Pie or donut charts: Useful for showing proportions, such as diversity ratios or sources of hires.
- Heatmaps: Effective for evaluating source performance or geographic talent distribution.
- Gauge charts or KPI cards: Perfect for summarizing critical metrics like cost-per-hire, which averaged $4,800 in the U.S. in 2025, with tech roles reaching $6,200.
Stick to a simple 3–4 color palette, using contrast only to highlight outliers. Avoid 3D charts, as they can make data harder to interpret. For metrics like time-to-hire, use the median instead of the average to reduce the impact of outliers.
Creating Views for Different Users
Different roles within your organization need different types of dashboards. Here’s how you can tailor views:
- Recruiters: Require operational dashboards that provide daily insights into pipeline volume, source performance, time-in-stage, and individual tasks.
- Hiring managers: Need tactical dashboards to monitor the status of open roles, candidate progression, and interview bottlenecks – typically reviewed weekly.
- Executives: Focus on strategic metrics like cost-per-hire, diversity benchmarks, and hiring volume versus plan, often reviewed monthly or quarterly.
Role-based access ensures users see only the data relevant to them, reducing clutter and confusion. Save role-specific views with pre-set filters, such as date ranges, departments, or job statuses, to keep everyone on the same page and minimize misinterpretation. Automated alerts can also notify users of critical changes, like a role exceeding its expected time-to-fill or a sudden drop in conversion rates.
Interestingly, companies using scientifically validated hiring assessments report about 10% higher productivity and 23% higher profitability. By tailoring dashboards to each role, you ensure everyone gets the insights they need to make informed decisions quickly.
Building Dashboards in Skillfuel
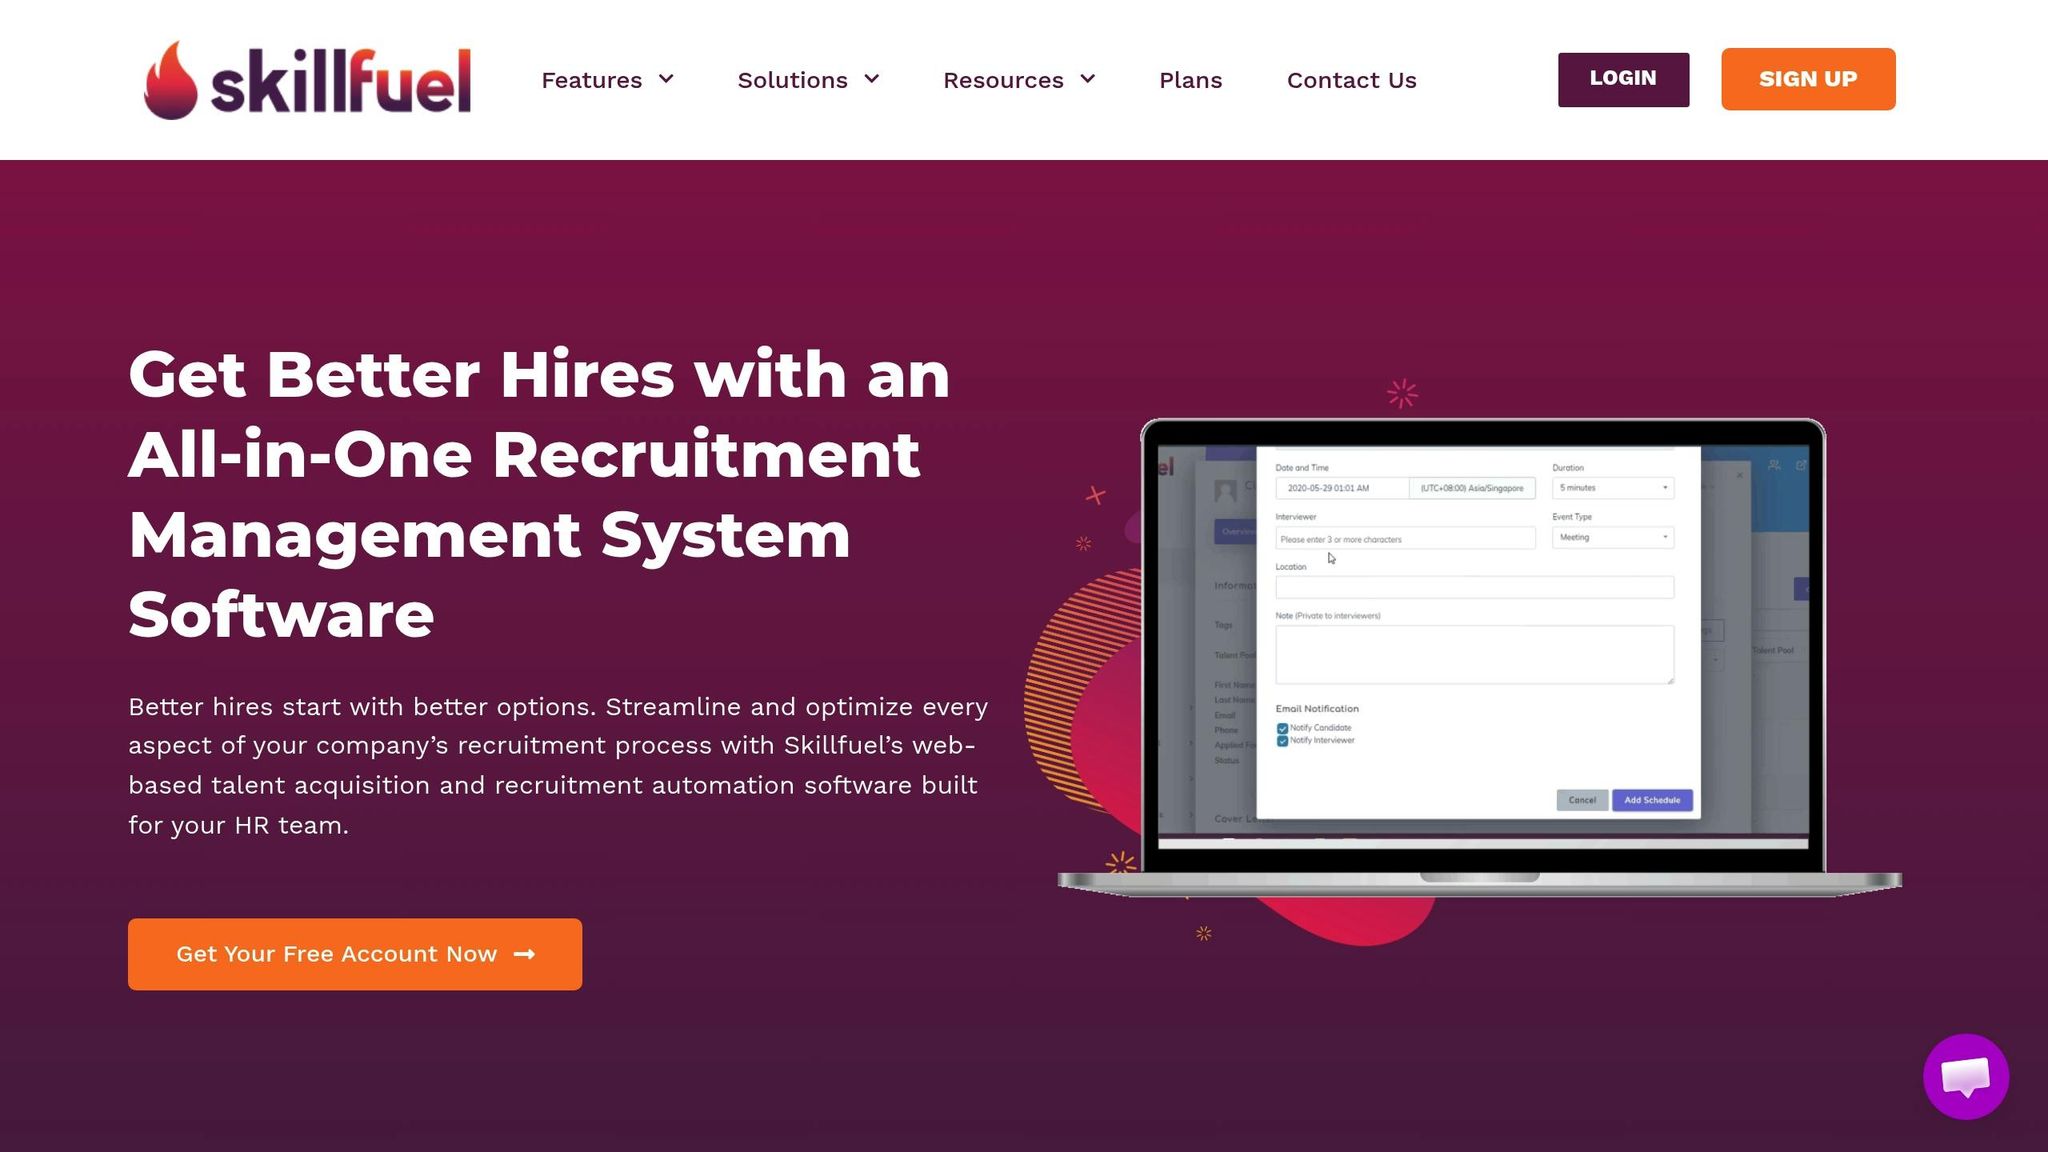
Once you’ve outlined your ideal dashboard layout, it’s time to bring it to life in Skillfuel. This platform merges candidate tracking, scheduling, messaging, and reporting into one streamlined interface, so you don’t have to juggle multiple tools. By centralizing these tasks, Skillfuel simplifies hiring decisions and saves time.
Using Skillfuel’s Dashboard Features
To get started, click the top-left logo, select "+New Dashboard," and choose between "Build from Scratch" or a pre-designed template.
Skillfuel’s drag-and-drop Kanban boards let you track candidate progress in real time, helping you identify bottlenecks – a challenge faced by 74% of employers. The integrated interview scheduler syncs directly with popular calendar apps, automating the process and cutting down on the endless back-and-forth emails that often slow things down.
To build your dashboard, use the "+ Add Widget" button to include widgets. Each widget comes with easy-to-use icons: the gear icon for configuration settings, the chart icon to switch between visual formats (like bar charts or tables), and the arrow loop to refresh data. This setup allows you to experiment with different layouts and visuals, tailoring the dashboard to your team’s needs.
Customizing Dashboard Fields
Once your dashboard is set up, you can fine-tune it to align with your recruitment workflows. Thanks to Skillfuel’s no-code customization, you can make adjustments without needing IT assistance. For instance, during setup or data import, you can modify workflow stages to better suit your department’s specific hiring process rather than relying on generic templates.
Role-specific views are another standout feature. Recruiters can focus on metrics like pipeline volume and source performance, while hiring managers can zero in on candidate progression and interview bottlenecks. The platform also tracks employee referrals and rewards, integrating this data directly into your recruitment dashboard. Plus, built-in GDPR compliance ensures that candidate data stays secure while you analyze performance.
Adding Filters and Automation
Filters help make dashboards more navigable. By clicking the gear icon on any widget, you can configure settings to segment data by parameters like date ranges, departments, job statuses, or other fields relevant to your hiring process.
Skillfuel’s "Automatic Candidate Updates" feature is a game-changer. It sends out timed emails to candidates as they move through the workflow, keeping them engaged without requiring manual follow-ups. You can even integrate personalized messages into these workflows, ensuring candidates receive timely updates that feel tailored to them. This automation is especially useful for maintaining interest during longer hiring cycles.
With these features in place, your dashboard becomes a powerful tool to streamline and optimize your hiring process.
Getting Started with Your Dashboard
Main Points to Remember
Start by defining the purpose of your dashboard. Do you need it for daily tasks (operational), long-term trends (analytical), or a mix of both? Collaborate with hiring managers and leadership to pinpoint the questions your dashboard should answer. For example, you might want to know where candidates drop off in the hiring process or whether you’re hitting monthly hiring targets.
Once you’ve identified the purpose, focus on choosing metrics that align with your goals. Key metrics might include time-to-hire, cost-per-hire, offer acceptance rates, and candidate source effectiveness. Next, figure out where your data will come from. Common sources include your Applicant Tracking System (ATS), payroll tools, candidate surveys, and job boards.
When designing the layout, keep it clean and straightforward. Use pie charts for proportions, bar charts for comparisons, and line charts to show trends over time. Avoid clutter by only including metrics that directly aid decision-making. Limit your color palette to three or four contrasting colors for better clarity. To ensure everyone gets what they need, create role-specific views – for example, recruiters, hiring managers, and executives can each see data relevant to their responsibilities.
Don’t forget to schedule regular audits to catch errors or inconsistencies in your data. And as hiring priorities shift, refine your dashboard to keep it aligned with your goals.
Building Your First Dashboard
Now that you’ve got the basics down, it’s time to build your first dashboard. Start by clicking the top-left Skillfuel logo, then select "+ New Dashboard". You can either build from scratch or customize a pre-made template like "Executive Overview" or "Recruiting Health." Use the "+ Add Widget" button to add the metrics you’ve chosen, and select the most appropriate chart types for each.
To keep things manageable, focus your first dashboard on answering one or two key questions. For example, if you’re tracking pipeline health, include widgets that show conversion rates at each stage and time spent in each stage. Use filters like date range, department, or job status by clicking the gear icon on any widget. You can also set up Automatic Candidate Updates to send timed emails as candidates move through the hiring process, reducing the need for manual follow-ups.
Plan to review your dashboard quarterly to ensure it stays relevant. As AIHR puts it:
"Recruitment dashboards are only as good as the strategy behind them. … The goal is not to visualize every available data point, but to create a reliable view of how hiring is performing and where action is required".
Start small, test your setup, and adjust based on how your team uses the data. Over time, you’ll build a dashboard that truly supports your hiring goals.
FAQs
What metrics should I include in my recruitment dashboard?
To create a recruitment dashboard that truly works, focus on tracking metrics that match your hiring goals and offer clear, actionable insights. Start with key performance indicators (KPIs) like time to fill, quality of hire, and retention rate – these are essential for evaluating how well your recruitment process performs.
Incorporate real-time data points such as application rates, pipeline health, and recruiter productivity. These measures help you keep tabs on progress and make quick, informed adjustments when needed. By emphasizing metrics that align with your hiring priorities, your dashboard can become a powerful tool for smarter, data-driven decision-making.
What are the best ways to integrate data sources into a recruitment dashboard?
To bring data sources into your recruitment dashboard, you can rely on tools that link directly to your recruitment systems, like applicant tracking systems (ATS), sourcing platforms, or HR software. For example, Skillfuel offers features that consolidate data from these systems, allowing for real-time reporting and more precise insights.
APIs or built-in integrations are another option to automate data collection, keeping your dashboard current without the need for manual updates. Alternatively, you can export data from your ATS into spreadsheets or visualization tools to build custom dashboards that align with your hiring goals. These approaches streamline data integration, making recruitment tracking more effective.
How can I create customized recruitment dashboards for different roles in my organization?
To build custom recruitment dashboards, start by pinpointing the specific needs and objectives of each user group – whether it’s recruiters, hiring managers, or executives. Each role has different priorities, so tailor the dashboard to highlight the key metrics that matter most to them. For instance:
- Recruiters might focus on candidate pipeline updates and upcoming interview schedules.
- Hiring managers may need visibility into candidate progress and metrics like time-to-fill.
- Executives often look for high-level insights, such as cost-per-hire and diversity statistics.
A tool like Skillfuel can simplify the process of creating these dashboards. Use its features to customize the layout by adding widgets or modules that showcase relevant data in a clear, easy-to-read format. Make it a habit to gather user feedback and adjust the dashboards regularly to keep pace with your organization’s changing hiring priorities.